Deep Dive on the Reds’ Key Underlying Statistics
Attack, Defence, Expected Goals and is there Room for Improvement?
Written on 19/10/2023 before the Everton Win
Liverpool’s start to the season has been positive and encouraging, to say the least. 17 points from eight league games (Ed - 20 from 9 now) along with wins in the Europa League and the Carabao Cup represents a good base to work with in the coming weeks and months.
To add a caveat to the start in the Premier League, the Reds have already played some of the tougher games a team gets throughout during the course of a season. Be it Chelsea away on the opening day or the tough battles at Newcastle and Brighton, Jürgen Klopp’s men have looked great in those games.
The only defeat came away at Tottenham. The less said about that the better (we know why!). Even in that game, the team did tremendously well to stay in it for a point when they went down to 10 and nine men.
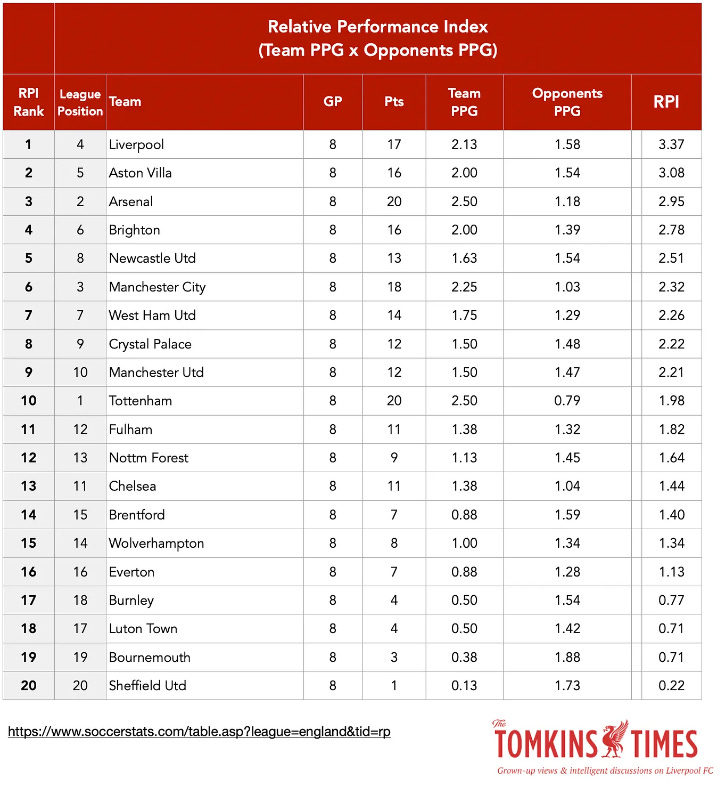
For that reason, although Liverpool are fourth in the table, their relative form has them topping the league at the moment. Here’s the ‘relative form league table’ to show you exactly that.
Table from Paul Tomkins
The 'Relative Performance Index' is calculated by multiplying the team's Points per Game (PPG) by the combined PPG average of their played opponents (Away PPG of opponents played at home and Home PPG of opponents played away).
The above table signifies an excellent start to the season Liverpool have had. The good thing is that this team is just getting started after a complete midfield revamp in the summer and two of the signings in that department taking place very late in the transfer window. Once the settling period is over, we can expect more consistency.
Let’s dive into more data and look at where Liverpool stand in them as we approach the second part of this season before the Christmas period.
Expected Goals Difference
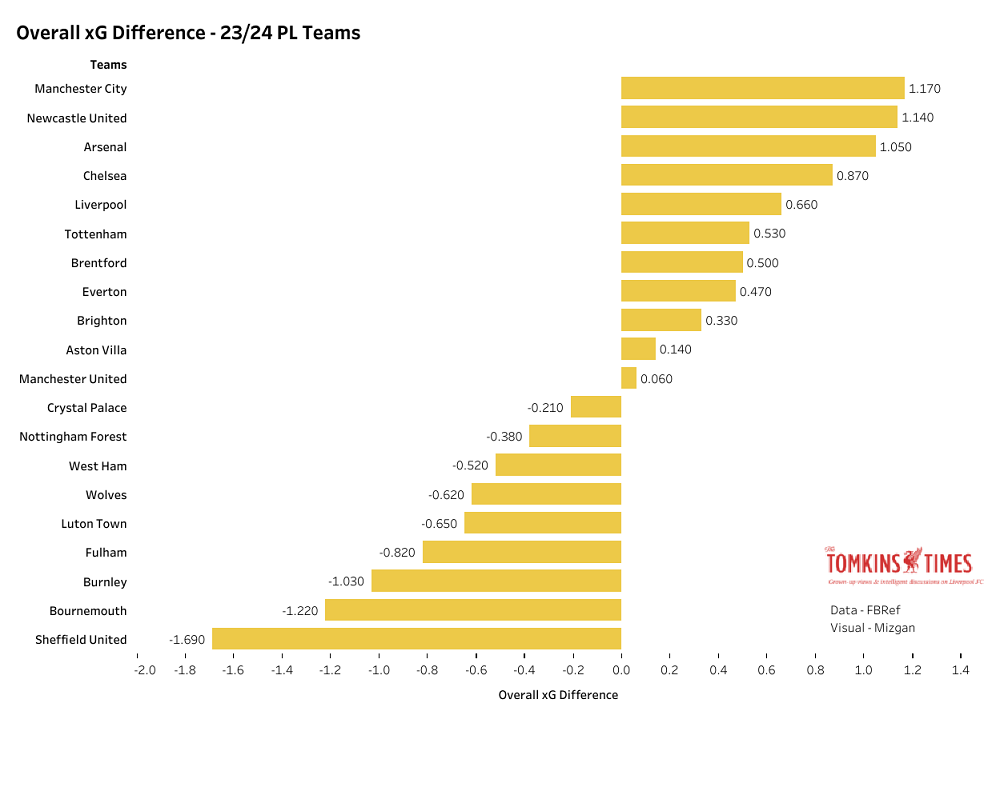
The expected goal difference metric generally gives us a better idea of how a team has fared so far in a season. Since Liverpool have played with less than 11 men in three of the eight league games, it is only fair to think that they would ship in more chances and territory to the opposition compared to when they would in the normal quota.
For that reason, we have two tables - one is the overall xG difference:
And the other adjusted to when teams had 11 men.
The adjusted xG difference table from Mark Taylor from Twitter.
If we look at the overall xG difference table, Liverpool are fifth. They jump up to the top when the adjusted metrics are added. Just goes to show that the Reds are doing well on instances when the referees are not sending their players for dubious reasons (none of the four red cards in the league this season have been clear-cut).
Keep reading with a 7-day free trial
Subscribe to TTT Transfer Hub & Deep Dives to keep reading this post and get 7 days of free access to the full post archives.


